Tilbage til forskningsbiblioteket
Original publikation
Ændringer i plasma-fedtsyrer hos patienter med bipolar depression under akut behandling med rTMS kombineret med quetiapin og stemningsstabiliserende medicin
Studiet undersøger, hvordan kombinationen af gentagne transkranielle magnetstimulationer (rTMS) og medicineringen quetiapin med stemningsstabiliserende medicin påvirker fedtsyrer i blodet hos patienter med bipolar depression. Der sammenlignes ikke med andre behandlinger eller placebo i det beskrevne forløb.
Titel og resumé er skrevet på dansk med AI ud fra den originale publikation. Originalteksten står nedenfor.
Yu H, Liang XJ, Qiao YT, Guo L, Li ZY, Zhou CH, Wu WJ, Li R, Peng ZW. · Brain and behavior · 2025
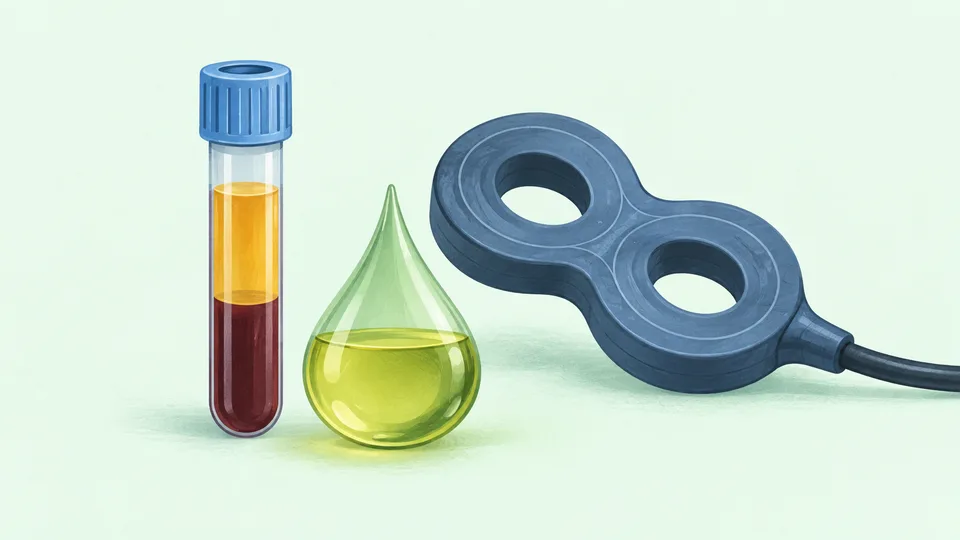 AI-billede
CC BY 4.0 · © 2025 The Author(s). Brain and Behavior published by Wiley Periodicals LLC.
Teksten oversættes automatisk og kan indeholde fejl. Originalteksten på engelsk er den gældende. Oversættelsen er ikke medicinsk rådgivning.
Alternations of Plasma Fatty Acids in Patients With Bipolar Depression Under Acute Treatment of rTMS Combined With Quetiapine and Mood Stabilizer
Original dokumenttekst
ABSTRACT
Purpose
Repetitive transcranial magnetic stimulation (rTMS) represents a potential clinical tool in treating bipolar disorder (BD). However, the intervention of rTMS combined with pharmacotherapy on the plasma fatty acids (FAs) in patients with bipolar depression has not been reported yet.
Method
In this study, we assessed the clinical symptoms and evaluated plasma FAs from 30 inpatients with bipolar depression at baseline phase (BD group), after 2 weeks of treatment with rTMS combined with quetiapine and mood stabilizer (BD‐2w group), and 32 healthy controls (HCs).
Finding
We found that acetic acid, propionic acid, isovaleric acid, isobutyric acid, and valeric acid, as well as levels of total short‐chain fatty acids (SCFAs), were decreased in both BD and BD‐2w groups, and levels of several medium‐ and long‐chain fatty acids (MLCFAs) were altered in BD when compared with HC. Moreover, 2 weeks of treatment increased the levels of various MLCFAs. Finally, we developed combinational FAs panels that could distinguish BD from HC (area under the curve [AUC] = 0.961), BD‐2w from HC (AUC = 0.978), and BD from BD‐2w (AUC = 0.891) effectively.
Conclusion
These findings might provide a basis for developing diagnostic methods and reveal the potential relationship between bipolar depression and plasma FAs.
Abstract
Plasma fatty acids (FAs) were altered in patients with bipolar depression.
Repetitive transcranial magnetic stimulation (rTMS) combined with quetiapine and mood stabilizer alleviated symptoms and changed plasma FAs composition in patients.
We identified FAs panels, which can distinguish bipolar disorder (BD) from healthy control (HC), BD‐2w from HC, and BD‐2w from BD as well.
1 Introduction
Bipolar disorder (BD) is a severe mental disorder that affects approximately 40 million individuals, ranking as the 17th leading source of disability among all diseases worldwide (Vigo, Thornicroft, and Atun 2016). The global prevalence of BD is approximately 2% (Merikangas et al. 2011) and its lifetime prevalence is 2.5% in men and 2.3% in women (McGrath et al. 2023). BD is associated with a higher risk of suicide, about 34% of patients with BD attempt suicide and 15%–20% die by suicide (Beyer and Weisler 2016; Dong et al. 2019; Plans et al. 2019) and the treatment compliance of BD patients is affected by some factors, such as substance use disorder and illness severity (Pompili et al. 2013). Moreover, BD is always combined with other psychiatric and cardiovascular diseases, such as anxiety disorders, substance use, hypertension, and diabetes (Crump et al. 2013; Hossain et al. 2019; Krishnan 2005). Manic or hypomanic episodes are the defining feature of BD, depression is the initial presentation in most patients which is one of the main reasons that nearly 40% of patients with BD are misdiagnosed as depression (Hirschfeld, Lewis, and Vornik 2003; Vieta and Suppes 2008). In addition, although most patients with BD have clinical features, accurate diagnosis can only be obtained after the first contact with primary healthcare providers for about 6–10 years (Dagani et al. 2017). Therefore, it is necessary to diagnose BD accurately and timely.
Several factors have been reported to be involved in the etiopathogenesis of BD, such as alternations in genetic, physiological, and immunoinflammatory (Dadouli et al. 2022; Scaini et al. 2020). Importantly, fatty acids (FAs) are essential in energy metabolism, immunoregulation, and signaling pathways (Panezai and van Dyke 2023; Zhang et al. 2023). FAs are classified as short‐chain fatty acids (SCFAs, a chain length from one to six carbons), and medium‐ and long‐chain fatty acids (MLCFAs, a chain length of more than eight carbons). SCFAs are mainly produced by the fecal microbiota fermentation of the dietary fiber whereas MLCFAs are primarily derived from dietary triglycerides (TGs). Despite their role as energy sources, increasing evidence indicates that FAs, mainly free FAs, are also natural ligands for a series of G protein‐coupled receptors (GPCRs), which interweave metabolism and immunity in many ways (Kimura et al. 2020). Recently, the role of FAs in psychiatric disorders has been reported. For example, peripheral FAs were altered in patients with schizophrenia and major depressive disorder (MDD; Liu et al. 2023). Furthermore, targeting FAs intake, especially omega‐3 polyunsaturated fatty acids (N3 PUFAs) might have potential benefits for the treatment of schizophrenia and MDD (Borsini et al. 2021; Goh et al. 2021). Correspondingly, the potential role of FAs in BD has also been revealed. Previous work found that plasma docosahexaenoic acid (DHA) was decreased while arachidonic acid (AA), eicosapentaenoic acid (EPA), and alpha‐linolenic acid (ALA) were increased in bipolar patients when compared with healthy controls (HCs; Pomponi et al. 2013). Recent studies also indicated that N3 PUFAs may be protective against BD and developmental N3 PUFA deficiency might be a risk factor for BD, whereas omega‐6 (N6) PUFAs and an increased ratio of N6:N3 may increase the risk of BD (McNamara et al. 2022; Zhang et al. 2023). Moreover, dietary intake or supplementation of PUFAs, especially N3 PUFAs seems to improve symptoms of BD (Gabriel et al. 2023). Nevertheless, the differences of FAs between patients with BD and healthy individuals, as well as the impact of repetitive transcranial magnetic stimulation (rTMS) combined with pharmacotherapy on the composition of plasma FAs, still need further elucidation.
Pharmacotherapy is the mainstay of treatment which should be adjusted according to the clinical manifestations of patients (hypomania/mania or depression; Baldessarini, Tondo, and Vazquez 2019). The main goal is to alleviate the symptoms of the current emotional episode, reduce the severity, and limit the number of future episodes. Combination therapy with atypical antipsychotic drugs, such as quetiapine, associated with a mood stabilizer, such as valproate, lithium, and lamotrigine, is recommended for both acute and long‐term treatment of BD in the majority of clinical practice guidelines (Kishi et al. 2022; Nestsiarovich et al. 2022; Yildiz et al. 2023). Recently, rTMS has been suggested as a treatment option for BD, especially for bipolar depression (Gold et al. 2019). The high‐frequency rTMS applied for the left dorsolateral prefrontal cortex (DLPFC) not only increased the response rates but also improved the processing speed and working memory of BD patients (Nguyen et al. 2021; Yang et al. 2019). Although our previous work found that rTMS could influence plasma FAs in patients with depression (Li et al. 2024), thus far, no study has reported the effect of rTMS combined with pharmacotherapy on plasma FA composition in patients with bipolar depression.
Considering the above, we hypothesized that the changes of FAs in peripheral blood may also participate in the pathogenesis of BD, and the alternations of specific FAs may be one of the molecular mechanisms of rTMS combined with pharmacotherapy. We detected the concentrations of plasma FAs from adult hospitalized patients with bipolar depression at baseline (BD, n = 30) and 2 weeks after rTMS combined with quetiapine and mood stabilizer treatment (BD‐2w, n = 30) and 32 gender‐ and age‐matched HCs. Meanwhile, we explored the characteristic changes of FAs among BD, BD‐2w, and HC, and developed the potential biomarkers of FAs that can distinguish BD and HC, BD‐2w, and HC, as well as BD and BD‐2w.
2 Methods
2.1 Participants
The diagnosis of BD was performed by a structured clinical interview based on the Diagnostic and Statistical Manual (DSM‐5) of Mental Disorders criteria. The Bech–Rafaelsen Mania Rating Scale (BRMS), 17‐item Hamilton Depression Rating Scale (HAMD), and Hamilton Anxiety Scale (HAMA) were used to assess the severity of symptoms. The clinical interview and scale evaluation were independently administered by senior psychiatrists who knew nothing about clinical trial design. The detailed pharmacotherapeutic combination and dose are presented in Supporting Information Table 1. The exclusion criteria were pregnancy, lactation, or menstrual period; hypertension; a severely imbalanced diet, such as high‐fat diet preferences; obesity, which was defined as a body mass index (BMI) ≥ 28.0; illicit drug use; diabetes; diseases of the digestive system; alcohol abuse or dependence; taking other antipsychotics; unable to complete 2‐week treatment or discharged early. Blood samples were collected and the plasma was obtained under fasting conditions between 8 am and 10 am. The blood lipids, including low‐density lipoprotein (LDL), high‐density lipoprotein (HDL), cholesterol (CHOL), TG, and blood glucose (GLU) were also detected.
2.2 rTMS
As described previously (Yang et al. 2019), treatment was administered using a TMS‐100 magnetic stimulator for 14 successive days (Max, Zhengzhou Medical Technology Company Ltd., China). The resting motor threshold (MT) was determined and patients received 10‐Hz rTMS (3000 pulses daily, delivered at 110% MT at 30‐s intertrain intervals) to the left DLPFC.
2.3 SCFAs and MLCFAs Measurement
The SCFAs and MLCFAs standard solution, MLCFAs extraction and sample were prepared as described previously (Li et al. 2024). Plasma SCFAs were detected by liquid chromatography–mass spectrometry (LC/MS). The LC–ESI–MS/MS (UHPLC‐Qtrap) was used as described previously (Phulpoto et al. 2024). The default parameters are used and manual inspection is assisted for identifying and integrating ion fragments. Then draw the linear regression standard curve and calculate the concentration results. Plasma MLCFAs were detected by gas chromatography–mass spectrometry (GC–MS). Gas chromatography (Agilent 8890b) and mass selective detector (Agilent 5977b/7000d) were used for analysis (Majorbio Pharm Technology Co. Ltd., Shanghai, China). The Masshunter quantitative software (Agilent, USA, version number: v10.0.707.0) was used to analyze the GC–MS raw data with default parameters to automatically identify and integrate all ion fragments, and manually check all integrations.
2.4 Statistical Analyses
Statistical analyses were performed by using R‐3.5.3 and SPSS 21.0. Except for the comparison of gender (chi‐squared analysis), the continuous variables were analyzed by the Shapiro–Wilk test. Then the normal distributed data were analyzed by using independent or paired samples t‐test (represented by mean ± standard deviation [SD]), and the abnormally distributed data, which was represented by M (P25, P75), was analyzed by using the Wilcoxon test or Mann–Whitney U test. MetaboAnalyst 5.0 (online software, https://www.metaboanalyst.ca/MetaboAnalyst/) was used to conduct random forest analysis and draw receiver operating characteristic (ROC) curves. The top 10 FAs with the greatest differences were selected as the candidate biomarker panel and correlations between the levels of these FAs and clinical parameters were assessed by Spearman correlation analysis.
3 Results
3.1 Clinical Data Evaluation
There were no significant differences between BD and HC in gender (p = 0.213), age (p = 0.767), BMI (p = 0.130), GLU (p = 0.260) and HDL (p = 0.163). However, the scores of HAMA (p = 0.014) and HAMD (p < 0.01), and the level of LDL (p = 0.001) were increased while the level of TG (p = 0.005) and CHOL (p = 0.024) were decreased in the BD group in comparison with the HC group (Table 1). There were no significant differences between BD‐2w and HC groups in terms of BMI (p = 0.105), TG (p = 0.172), the scores of HAMA (p = 0.091) and CHOL (p = 0.166). However, levels of HDL (p = 0.049) and GLU (p = 0.021) were decreased whereas scores of HAMD (p = 0.027) and levels of LDL were increased in the BD‐2w when compared with the HC group (Table 2). Furthermore, we also compared the clinical data between the BD and BD‐2w groups. There were no significant differences between BD and BD‐2w in terms of TG (p = 0.199), LDL (p = 0.067) and CHOL (p = 0.102). However, the scores of HAMA, BRMS, and HAMD (all p < 0.01), and levels of HDL and GLU (all p < 0.05) were decreased in the BD‐2w group in comparison with the BD group (Table 3). Detailed clinical and demographic characteristics are shown in Supporting Information Table 1.
3.2 Comparison of SCFAs in BD, BD‐2w, and HC
Except for 4‐methylvaleric acid, concentrations of total SCFAs (Z = −5.141, p < 0.001), acetic acid (Z = −4.9916, p < 0.001), propionic acid (Z = −4.043, p < 0.001), isovaleric acid (Z = −5.057, p < 0.001), butyric acid (Z = −2.485, p < 0.05), caproic acid (Z = −5.254, p < 0.001), isobutyric acid (Z = −6.142, p < 0.001), and valeric acid (Z = −5.410, p < 0.001) were decreased in BD than that in the HC group. Similarly, concentrations of total SCFAs (Z = −4.916, p < 0.001), acetic acid (Z = −4.761, p < 0.001), propionic acid (Z = −4.972, p < 0.001), isovaleric acid (Z = −5.798, p < 0.001), caproic acid (Z = −5.353, p < 0.001), isobutyric acid (Z = −5.888, p < 0.001), and valeric acid (Z = −4.219, p < 0.001) were decreased in BD‐2w than that in the HC group. Wilcoxon test or paired samples t‐test showed that there were no significant differences between BD and BD‐2w in terms of total SCFAs (Z = −1.059, p = 0.289), acetic acid (Z = −0.998, p = 0.318), propionic acid (Z = −1.306, p = 0.192), isovaleric acid (Z = −1.224, p = 0.221), isobutyric acid (Z = −1.296, p = 0.159), butyric acid (Z = −1.872, p = 0.061), 4‐methylvaleric acid (Z = −0.936, p = 0.349), and valeric acid (t = −1.152, p = 0.165). Only levels of caproic acid (Z = −3.189, p < 0.001) were increased in BD‐2w than that in the BD group. It suggests that most plasma SCFAs were decreased in BD patients. However, only the levels of capronic acid and butyric acid were increased after 2 weeks of pharmacotherapy (Figure 1A).
3.3 Comparison of PUFAs in BD, BD‐2w, and HC
There were no significant differences between BD and HC groups in the concentrations of C18:3n6 (Z = −1.690, p = 0.091), C18:3n3 (Z = −1.211, p = 0.226), C20:2 (Z = −0.958, p = 0.338), C20:3n3 (Z = −0.846, p = 0.398), C20:4n6 (Z = −0.887, p = 0.375), C20:5n3 (Z = −1.155, p = 0.248), C22:5n3 (Z = −0.324, p = 0.746), C20:3n6 (Z = −0.662, p = 0.508), and C22:6n3 (t = −1.362, p = 0.178). In addition, levels of C22:4 (t = −2.185, p = 0.034) and C22:5n6 (t = −3.221, p = 0.003) were increased whereas levels of C18:2n6c (t = 3.413, p = 0.001) were decreased in BD than that in the HC group. Moreover, there were no significant differences between BD‐2w and HC groups in the concentrations of C18:3n3 (Z = −1.211, p = 0.226), C20:3n3 (Z = −0.127, p = 0.899), C20:4n6 (Z = −1.902, p = 0.057), C18:2n6c (t = −0.537, p = 0.598). Whereas levels of C18:3n6 (Z = −4.155, p < 0.001), C20:2 (Z = −4.324, p < 0.001), C20:5n3 (Z = −4.240, p < 0.001), C22:5n3 (Z = −2.381, p = 0.017), C22:5n6 (Z = −5.324, p < 0.001), C22:6n3 (Z = −2.634, p = 0.008), C22:4 (t = −5.458, p < 0.001), and C20:3n6 (t = −4.871, p < 0.001) were increased in BD‐2w than that in the HC group. Furthermore, paired sample tests found that levels of C18:3n6 (Z = −3.898, p < 0.001), C20:2 (Z = −4.247, p < 0.001), C20:4n6 (Z = −2.705, p = 0.007), C20:5n3 (Z = −2.869, p = 0.004), C22:5n3 (Z = −3.075, p = 0.002), C22:5n6 (Z = −3.034, p = 0.002), C20:3n6 (Z = −4.268, p < 0.001), C18:2n6c (t = −3.442, p = 0.002), and C22:4 (t = −4.220, p < 0.001) were increased in BD‐2w than that in the BD group (Figure 1B).
In the comparison of the HC group, concentrations of total PUFAs (Z = −3.113, p = 0.002) and total N6 PUFAs (t = 3.278, p = 0.002) were decreased in the BD group, and the total N3 PUFAs (Z = −2.888, p = 0.004) were increased in BD‐2w group. Moreover, concentrations of total PUFAs (Z = −2.394, p = 0.003) and total N6 PUFAs (t = −3.540, p = 0.001) were decreased in the BD group when compared with the BD‐2w group (Figure 1E). It suggests that plasma PUFAs and N6 PUFAs were decreased in patients with BD, quetiapine combined with mood stabilizers can not only improve this phenomenon but also increase the level of N3 PUFAs.
3.4 Comparison of SFAs and MUFAs in BD, BD‐2w, and HC
There were no significant differences between BD and HC groups in the concentrations of C12:0 (Z = −1.648, p = 0.099), C13:0 (Z = −1.121, p = 0.262), C14:0 (Z = −1.254, p = 0.210), C20:0 (Z = −1.254, p = 0.210), C22:0 (Z = −1.317, p = 0.188), C16:0 (t = 0.512, p = 0.610), and C15:0 (t = 1.884, p = 0.064). However, levels of C10:0 (Z = −2.015, p = 0.044), C17:0 (Z = −2.599, p = 0.009), and C8:0 (Z = −2.854, p = 0.004) were decreased in BD than that in the HC group. Moreover, levels of C10:0 (Z = −2.642, p = 0.008), C12:0 (Z = −2.704, p = 0.007), C14:0 (Z = −3.888, p < 0.001), C17:0 (Z = −2.704, p = 0.007), C20:0 (Z = −2.789, p = 0.005), C22:0 (Z = −3.613, p < 0.001), C15:0 (Z = −3.324, p < 0.001), C16:0 (t = −3.529, p < 0.001), C18:0 (t = −3.004, p = 0.005) were increased in BD‐2w than that in the HC group. Paired sample tests further found that levels of C8:0 (Z = −2.952, p = 0.003), C10:0 (Z = −2.499, p = 0.012), C12:0 (Z = −2.982, p = 0.003), C14:0 (Z = −4.350, p < 0.001), C15:0 (Z = −3.630, p < 0.001), C17:0 (Z = −3.507, p < 0.001), C20:0 (Z = −2.581, p = 0.010), C22:0 (Z = −2.551, p = 0.011), C16:0 (t = −4.480, p < 0.001), C18:0 (t = −4.444, p < 0.001) were increased in BD‐2w than that in the BD group (Figure 1C).
No significant differences between BD and HC groups were observed in terms of C16:1 (Z = −0.310, p = 0.757), C18:1n11c (Z = −0.225, p = 0.822), C20:1T (Z = −0.662, p = 0.508), C20:1 (Z = −0.620, p = 0.535), C22:1T (Z = −0.349, p = 0.693), and C18:1n9c (t = 0.530, p = 0.598). However, levels of C16:1 (Z = −3.296, p < 0.001), C18:1n11c (Z = −2.817, p = 0.005), C20:1T (Z = −4.578, p < 0.001), C20:1 (Z = −3.867, p < 0.001), C22:1T (Z = −4.817, p < 0.001), and C18:1n9c (t = −3.016, p = 0.004) were increased in BD‐2w than that in the HC group. These MUFAs, except C20:1, were also increased in BD‐2w than that in the BD group (Figure 1D). Furthermore, in comparison of the HC group, concentrations of total SFAs (t = −3.055, p = 0.004) and total MUFAs (Z = −3.455, p = 0.001) were increased in the BD‐2w group. Similarly, both total SFAs (t = −4.627, p < 0.001) and total MUFAs (Z = −3.260, p = 0.001) were increased in the BD‐2w group when compared with the BD group (Figure 1E). Together, quetiapine combined with mood stabilizers intervention upregulates a large amount of SFAs and MUFAs levels in patients, while there were fewer changes between the BD and HC groups.
3.5 Characteristic Plasma FAs Between BD and HC, BD‐2w and HC, and BD and BD‐2w
Differential FAs between BD and HC groups including isobutyric acid, isovaleric acid, caproic acid, valeric acid, acetic acid, propionic acid, C20:1, C22:5n6, C18:2n6c, and C22:4 were selected as a panel that can distinguish BD from HC effectively (area under the curve [AUC] = 0.961, Figure 2A,B). Moreover, concentrations of acetic acid, isovaleric acid, propionic acid, caproic acid, isobutyric acid, and valeric acid were negatively correlated while concentrations of C22:5n6 and C22:4 were positively correlated with the content of LDL. Levels of acetic acid and isobutyric acid were also negatively correlated with BMI and scores of HAMD, and only levels of caproic acid and valeric acid were negatively correlated with scores of HAMA (Figure 2C). Moreover, a panel containing isobutyric acid, isovaleric acid, C22:5n6, C22:4, caproic acid, acetic acid, C22:1T, C20:2, C20:1T, and valeric acid could effectively distinguish BD‐2w and HC (AUC = 0.978, Figure 2D,E). Levels of C22:5n6, C22:1T, C22:4, C20:1T, and C20:2 were positively correlated whereas levels of isobutyric acid, caproic acid, valeric acid, and acetic acid were negatively correlated with levels of LDL. Concentrations of acetic acid and isobutyric acid were negatively correlated with BMI, concentrations of isovaleric acid were negatively correlated with scores of HAMD and HAMA, and levels of caproic acid were negatively correlated with scores of HAMA (Figure 2F). Finally, a panel consisting of C18:3n6, C20:1T, caproic acid, C12:0, C20:3n6, C20:0, C22:1T, C15:0, C14:0, and C18:0 distinguish BD and BD‐2w (AUC = 0.891, Figure 2G,H). Levels of C15:0, C14:0, C18:0, C22:1T, and C20:3n6 were negatively correlated with scores of BRMS, while levels of C20:0, C14:0, C18:3n6, C20:1T, C18:0, C22:1T, and C20:3n6 were positively correlated with TG and CHOL. Content of C20:1T was negatively correlated with scores of HAMD and HAMA, and levels of C18:3n6 were negatively correlated with scores of HAMD (Figure 2I). These results indicated that the decreased content of isobutyric acid, isovaleric acid, caproic acid, propionic acid, valeric acid, acetic acid, and C18:2n6c, and increased levels of C20:1, C22:5n6, and C22:4 might be a potential feature that could effectively distinguish BD from HC. Meanwhile, the decreased levels of isobutyric acid, isovaleric acid, caproic acid, acetic acid, and valeric acid, and increased levels of C22:5n6, C22:4, C22:1T, C20:2, and C20:1T might be a potential feature that could effectively distinguish BD‐2w from HC. Whereas the increased levels of C18:3n6, C20:1T, caproic acid, C12:0, C20:3n6, C20:0, C22:1T, C15:0, C14:0, and C18:0 might be a potential biomarker that could effectively distinguish BD‐2w from BD.
4 Discussion
In this study, we elucidated the plasma composition of FAs quantitatively and identified FAs panels, which can distinguish BD from HC (AUC = 0.961), BD‐2w from HC (AUC = 0.978), and BD‐2w from BD (AUC = 0.891) as well. To our knowledge, this is the first study to report the effect of rTMS combined with quetiapine and mood stabilizer intervention on plasma FAs in patients with BD. These results may help the clinical diagnosis of bipolar depression and explain the peripheral molecular mechanism for the acute intervention of rTMS combined with quetiapine and mood stabilizers.
BD is likely caused by the complex interaction of multiple factors, including genetics, neurodevelopment and environmental factors, psychological function, brain networks, hypothalamic–pituitary–adrenal (HPA) axis and gut–brain axis (Harrison, Geddes, and Tunbridge 2019; Li et al. 2022; Patel et al. 2021; Shintani et al. 2023). Family history is the key risk factor for BD. The risk of BD in first‐degree relatives is about eightfold higher than that in the baseline population (Song et al. 2015), and adoption and twin studies also indicated the heritability of BD estimates of approximately 60%–80% (Althoff et al. 2005; Lichtenstein et al. 2009). However, the genetic risk for BD seems to be spread across numerous common variants (Mullins et al. 2021), whereas polygenic risk lacks populational representation and it also interprets with gene–environment correlations (Mostafavi et al. 2020), which limits the application of genetic markers in diagnosing BD. On the other hand, the neuroimaging analysis found broad but minor reductions in the thickness of the temporal, parietal, and frontal cortex (Hibar et al. 2018). Diffuse tension imaging also found the integrity of white matter in the entire brain is generally reduced, especially in the bilateral cinguli and corpus callosum (Favre et al. 2019). Although these findings are highly replicable, they have not yet been clinically applied, mainly because they reflect differences at the group level and the cross with other psychiatric disorders (Nunes et al. 2020; Opel et al. 2020). Considering disturbance in peripheral blood inflammation, oxidative stress, metabolites, and neurotrophins was related to disease activity and neuroprogression in BD (Munkholm, Vinberg, and Kessing 2016; Quintero et al. 2019; Rodrigues et al. 2022), it may be of positive significance to observe the characteristic molecular changes in the blood of patients with BD and establish diagnostic biomarkers.
rTMS mainly demonstrated a positive effect on the treatment of depression (Sackeim 2016), whereas the efficacy of rTMS on BD was inconsistent. A meta‐analysis indicates the response rates of rTMS on bipolar depression were higher than that of sham (Nguyen et al. 2021). However, the blinded, randomized, sham‐controlled literature using rTMS in BD is limited (Konstantinou et al. 2022; Nguyen et al. 2021), and a randomized clinical trial found no evidence for the antidepressant efficacy of iTBS when compared with sham by using clinician‐rated depressive symptoms (McGirr et al. 2021). The discrepancy might be mainly related to the heterogeneity among the study designs, patients and control groups recruited, the course of illness, previous treatments, and small study sample sizes. Considering that the main purpose of this study is to observe the changes in blood FAs metabolism before and after effective treatment. We combined rTMS with pharmacotherapy and found that the combined intervention for 2 weeks effectively alleviated the symptoms related to BD (manifested by a significant decrease in HAMA, HAMD, and BRMS, Table 3), suggesting that the combination of rTMS and pharmacotherapy may have a certain therapeutic effect on bipolar depression. However, due to the lack of a separate drug intervention group, we do not know whether the effectiveness of this combination therapy is better than monotherapy.
FAs are important sources of energy, they also influence neuroinflammation, oxidative stress, and neurotrophins (Morant‐Ferrando et al. 2023; Zhuang et al. 2022; Ziaei et al. 2024). Among them, SCFAs are generally produced by the fecal microbiota and play a role in the function of gut–brain axis. SCFAs can regulate the synthesis of neurotransmitters, tryptophan metabolism, and activity of the HPA axis (Erny et al. 2015; Yano et al. 2015). Previous studies found that SCFAs affect recognition and emotional states (Aho et al. 2021), and levels of SCFAs were correlated with the severity of depressive symptoms (Burton et al. 2023; Skonieczna‐Zydecka et al. 2018). However, the overall alternations of SCFAs in patients with BD are unclear. In the present study, we found that most SCFAs levels, including acetic acid, isovaleric acid, propionic acid, isobutyric acid, and valeric acid, as well as levels of total SCFAs, were decreased in both BD and BD‐2w groups, indicating the decrease of the above SCFAs might be involved in the pathogenesis of BD, but it cannot reflect the effectiveness of rTMS combined with pharmacotherapy. Importantly, we found that levels of butyric acid were normalized and levels of caproic acid were increased after 2 weeks of intervention. Meanwhile, levels of caproic acid were also negatively correlated with scores of HAMA. Butyric acid has anti‐inflammatory and antioxidant properties (Zhou et al. 2023), and it could elevate levels of brain‐derived neurotrophic factor (BDNF) in specific brain regions and relieve depressive‐like behaviors in animal models of depression (Schroeder et al. 2007; Wei et al. 2015). Caproic acid also has immunomodulatory properties, a recent study found that the increase of butyric acid and caproic acid was negatively related to intestinal permeability and inflammation (Liu et al. 2022). Together, these results suggest that the plasma butyric acid and caproic acid might alleviate BD symptoms through their immunomodulatory properties, and the increased butyric acid and caproic acid might be potential indicators for the efficacy of rTMS combined with pharmacotherapy.
MLCFAs were classified as SFAs, MUFAs, and PUFAs and played a role in regulating inflammation, brain structure, and function. Previous studies found that intake of SFA induced depressive‐like behaviors while intake of MUFA promoted signal transduction of neurotransmitters in animals (Sartorius et al. 2012; Sharma and Fulton 2013). Clinical studies already investigated the involvement of MLCFAs in BD. Pomponi et al. found that plasma DHA was decreased while ALA, AA, and C20:5n3 (EPA) were increased in bipolar patients (Pomponi et al. 2013). Evans et al. found that PUFAs intake, and plasma concentrations of PUFAs, including C20:2n6 (eicosadienoic acid, EDA), C18:2n6 (linoleic acid, LA), and EPA, were decreased in bipolar individuals when compared to HCs (Evans et al. 2014). Moreover, patients with BD exhibited abnormal elevations in 18:0 (stearic acid), C16:0 (palmitic acid), LA, AA, and DHA, and reductions in 18:1n9 (oleic acid) in postmortem superior temporal gyrus (McNamara et al. 2014). Here, we found that levels of C22:5n6 and C22:4 were increased whereas levels of C10:0, C17:0, C8:0, LA, total PUFAs, and total N6 PUFAs were decreased in BD than those in the HC group. However, no significant differences between the BD and HC in MUFAs were observed, suggesting that there is an insufficient correlation between plasma MUFAs composition and BD. These discrepancies may arise from the differences in dietary habits, age, gender composition, and sample size among the included subjects. Surprisingly, a large number of MLCFAs, such as C20:5n3 and C22:5n6 as well as total SFAs and MUFAs, were increased in the BD‐2w group when compared with the HC or BD group, indicating that the upregulated peripheral MLCFAs might be potential prediction indicators for rTMS combined with pharmacotherapy.
Considering the diagnosis and treatment of BD still mainly rely on subjective clinical exercises rather than any biological markers nowadays (Nierenberg et al. 2023), we also developed FA panels that could distinguish BD from HC, BD‐2w from HC, and BD from BD‐2w. Notably, SCFAs mainly consisted of the panel that could distinguish BD and HC, while SFAs account for half of the panel that can distinguish BD and BD‐2w, the potential mechanism of the influence of rTMS or pharmacotherapy on plasma FAs is still unreported and needs to be further investigated. Importantly, in the molecular marker panel that distinguishes the BD and HC groups, the levels of eight molecules are related to the level of LDL. Among the molecular marker combinations that distinguish BD and BD‐2w groups, the levels of seven molecules were positively correlated with levels of TG and CHOL. Given that both FAs and antipsychotics combined with mood stabilizers can regulate lipid metabolism (Fushimi et al. 2006; Kohler‐Forsberg et al. 2023), it is difficult to determine the causal relationship between changes in FAs and blood lipid levels.
Nevertheless, several limitations of the present study need to be clarified. First, the enrolled number of patients was limited. We did not distinguish patients with bipolar type I and type II, and we also did not set the validation queue, the alternations of plasma FAs content for different kinds of BD and its relationship with diagnosis and treatment efficacy still need to be further validated through large‐scale studies. Second, we did not strictly limit the daily dosage of quetiapine used, and patients received different kinds of mood stabilizers, including magnesium valproate, lithium carbonate, or sodium valproate, the impact of various drug combinations on FAs is still unclear. Similarly, considering the high rate of treatment failure of monotherapy (Bohlken et al. 2021), we did not set up a monotherapy treatment group, it is unclear whether there is a synergistic effect among rTMS, quetiapine, and mood stabilizers. Moreover, we did not control the patient's diet during hospitalization and the patient is not a first‐episode, the influence of diet and previously used drugs or other treatment methods (such as psychotherapy) on plasma FAs cannot be excluded. Finally, the causal relationship between changes in plasma FAs and symptoms of BD is still unclear, and the therapeutic effect of combining exogenous MLCFAs with traditional treatment or improving gut microbiota by probiotics to regulate SCFAs on BD needs to be further investigated.
5 Conclusion
In summary, we characterized the plasma FAs in adult hospitalized patients with bipolar depression before and after rTMS combined with pharmacotherapy intervention. Moreover, we developed combined FAs consisted panels that could effectively distinguish BD from HC, BD‐2w from HC, and BD from BD‐2w. Our results suggest that rTMS combined with pharmacotherapy may play a role in the treatment of BD by regulating peripheral FAs metabolism, which may provide theoretical data for future improvement of BD treatment strategies. Meanwhile, our results also provide a basis for developing diagnostic methods and reveal the potential relationship between plasma FAs and bipolar depression.
Author Contributions
Huan Yu: Investigation, writing–original draft, validation. Xue‐jun Liang: Investigation, data curation. Yu‐ting Qiao: Investigation, validation, data curation. Lin Guo: Data curation, investigation. Zhao‐yang Li: Data curation. Cui‐hong Zhou: Formal analysis. Wen‐jun Wu: Investigation, funding acquisition. Rui Li: Conceptualization, writing–original draft, writing–review and editing. Zheng‐wu Peng: Conceptualization, writing–original draft, writing–review and editing, funding acquisition, supervision.
Conflicts of Interest
The authors declare no conflicts of interest.
Peer Review
The peer review history for this article is available at https://publons.com/publon/10.1002/brb3.70341
Ethics Statement
The research protocol was approved and registered by the Chinese Clinical Trial Ethics Committee (number: ChiECRCT20200090) and Clinical Trial Registry (number: ChiCTR2000032118).
Referencer citeret i publikationen
- Aho, V. T. E. , M. C. Houser , P. A. B. Pereira , et al. 2021. “Relationships of Gut Microbiota, Short‐Chain Fatty Acids, Inflammation, and the Gut Barrier in Parkinson's Disease.” Molecular Neurodegeneration 16, no. 1: 6. 10.1186/s13024-021-00427-6.33557896 PMC7869249
- Althoff, R. R. , S. V. Faraone , D. C. Rettew , C. P. Morley , and J. J. Hudziak . 2005. “Family, Twin, Adoption, and Molecular Genetic Studies of Juvenile Bipolar Disorder.” Bipolar Disorders 7, no. 6: 598–609. 10.1111/j.1399-5618.2005.00268.x.16403185
- Baldessarini, R. J. , L. Tondo , and G. H. Vazquez . 2019. “Pharmacological Treatment of Adult Bipolar Disorder.” Molecular Psychiatry 24, no. 2: 198–217. 10.1038/s41380-018-0044-2.29679069
- Beyer, J. L. , and R. H. Weisler . 2016. “Suicide Behaviors in Bipolar Disorder: A Review and Update for the Clinician.” Psychiatric Clinics of North America 39, no. 1: 111–123. 10.1016/j.psc.2015.09.002.26876322
- Bohlken, J. , S. Riedel‐Heller , M. Bauer , and K. Kostev . 2021. “Bipolar Disorder and Outcomes of Monotherapy With Lithium, Valproate, Quetiapine, Olanzapine, Venlafaxine, and Citalopram.” Pharmacopsychiatry 54, no. 3: 126–130. 10.1055/a-1348-1523.33494115
- Borsini, A. , A. Nicolaou , D. Camacho‐Muñoz , et al. 2021. “Omega‐3 Polyunsaturated Fatty Acids Protect Against Inflammation Through Production of LOX and CYP450 Lipid Mediators: Relevance for Major Depression and for Human Hippocampal Neurogenesis.” Molecular Psychiatry 26, no. 11: 6773–6788. 10.1038/s41380-021-01160-8.34131267 PMC8760043
- Burton, T. C. J. , N. Lv , P. Tsai , et al. 2023. “Associations Between Fecal Short‐Chain Fatty Acids, Plasma Inflammatory Cytokines, and Dietary Markers With Depression and Anxiety: Post Hoc Analysis of the ENGAGE‐2 Pilot Trial.” American Journal of Clinical Nutrition 117, no. 4: 717–730. 10.1016/j.ajcnut.2023.01.018.36796440 PMC10273083
- Crump, C. , K. Sundquist , M. A. Winkleby , and J. Sundquist . 2013. “Comorbidities and Mortality in Bipolar Disorder: A Swedish National Cohort Study.” JAMA Psychiatry 70, no. 9: 931–939. 10.1001/jamapsychiatry.2013.1394.23863861
- Dadouli, K. , M. B. Janho , A. Hatziefthimiou , et al. 2022. “Neutrophil‐to‐Lymphocyte, Monocyte‐to‐Lymphocyte, Platelet‐to‐Lymphocyte Ratio and Systemic Immune‐Inflammatory Index in Different States of Bipolar Disorder.” Brain Sci 12, no. 8: 1034. 10.3390/brainsci12081034.36009097 PMC9405738
- Dagani, J. , G. Signorini , O. Nielssen , et al. 2017. “Meta‐Analysis of the Interval Between the Onset and Management of Bipolar Disorder.” Canadian Journal of Psychiatry‐Revue Canadienne De Psychiatrie 62, no. 4: 247–258. 10.1177/0706743716656607.27462036 PMC5407546
- Dong, M. , L. Lu , L. Zhang , et al. 2019. “Prevalence of Suicide Attempts in Bipolar Disorder: A Systematic Review and Meta‐Analysis of Observational Studies.” Epidemiology and Psychiatric Sciences 29: e63. 10.1017/S2045796019000593.31648654 PMC8061290
- Erny, D. , A. L. Hrabe de Angelis , D. Jaitin , et al. 2015. “Host Microbiota Constantly Control Maturation and Function of Microglia in the CNS.” Nature Neuroscience 18, no. 7: 965–977. 10.1038/nn.4030.26030851 PMC5528863
- Evans, S. J. , R. N. Ringrose , G. J. Harrington , P. Mancuso , C. F. Burant , and M. G. McInnis . 2014. “Dietary Intake and Plasma Metabolomic Analysis of Polyunsaturated Fatty Acids in Bipolar Subjects Reveal Dysregulation of Linoleic Acid Metabolism.” Journal of Psychiatric Research 57: 58–64. 10.1016/j.jpsychires.2014.06.001.24953860 PMC4127886
- Favre, P. , M. Pauling , J. Stout , et al. 2019. “Widespread White Matter Microstructural Abnormalities in Bipolar Disorder: Evidence From Mega‐ and Meta‐Analyses Across 3033 Individuals.” Neuropsychopharmacology 44, no. 13: 2285–2293. 10.1038/s41386-019-0485-6.31434102 PMC6898371
- Fushimi, T. , K. Suruga , Y. Oshima , M. Fukiharu , Y. Tsukamoto , and T. Goda . 2006. “Dietary Acetic Acid Reduces Serum Cholesterol and Triacylglycerols in Rats Fed a Cholesterol‐Rich Diet.” British Journal of Nutrition 95, no. 5: 916–924. 10.1079/bjn20061740.16611381
- Gabriel, F. C. , M. Oliveira , M. M. Bruna De , et al. 2023. “Nutrition and Bipolar Disorder: A Systematic Review.” Nutritional Neuroscience 26, no. 7: 637–651. 10.1080/1028415X.2022.2077031.35608150
- Goh, K. K. , C. Y. Chen , C. H. Chen , and M. L. Lu . 2021. “Effects of Omega‐3 Polyunsaturated Fatty Acids Supplements on Psychopathology and Metabolic Parameters in Schizophrenia: A Meta‐Analysis of Randomized Controlled Trials.” Journal of Psychopharmacology 35, no. 3: 221–235. 10.1177/0269881120981392.33586517
- Gold, A. K. , A. C. Ornelas , P. Cirillo , et al. 2019. “Clinical Applications of Transcranial Magnetic Stimulation in Bipolar Disorder.” Brain Behav 9, no. 10: e01419. 10.1002/brb3.1419.31566935 PMC6790310
- Harrison, P. J. , J. R. Geddes , and E. M. Tunbridge . 2019. “The Emerging Neurobiology of Bipolar Disorder.” Focus (American Psychiatric Publishing) 17, no. 3: 284–293. 10.1176/appi.focus.17309.32015720 PMC6996057
- Hibar, D. P. , L. T. Westlye , N. T. Doan , et al. 2018. “Cortical Abnormalities in Bipolar Disorder: An MRI Analysis of 6503 Individuals From the ENIGMA Bipolar Disorder Working Group.” Molecular Psychiatry 23, no. 4: 932–942. 10.1038/mp.2017.73.28461699 PMC5668195
- Hirschfeld, R. M. , L. Lewis , and L. A. Vornik . 2003. “Perceptions and Impact of Bipolar Disorder: How Far Have We Really Come? Results of the National Depressive and Manic‐Depressive Association 2000 Survey of Individuals With Bipolar Disorder.” Journal of Clinical Psychiatry 64, no. 2: 161–174.12633125
- Hossain, S. , P. Mainali , N. N. Bhimanadham , S. Imran , N. Ahmad , and R. S. Patel . 2019. “Medical and Psychiatric Comorbidities in Bipolar Disorder: Insights From National Inpatient Population‐Based Study.” Cureus 11, no. 9: e5636. 10.7759/cureus.5636.31700739 PMC6822913
- Kimura, I. , A. Ichimura , R. Ohue‐Kitano , and M. Igarashi . 2020. “Free Fatty Acid Receptors in Health and Disease.” Physiological Reviews 100, no. 1: 171–210. 10.1152/physrev.00041.2018.31487233
- Kishi, T. , T. Ikuta , Y. Matsuda , et al. 2022. “Pharmacological Treatment for Bipolar Mania: A Systematic Review and Network Meta‐Analysis of Double‐Blind Randomized Controlled Trials.” Molecular Psychiatry 27, no. 2: 1136–1144. 10.1038/s41380-021-01334-4.34642461 PMC9054678
- Kohler‐Forsberg, O. , L. G. Sylvia , M. Thase , et al. 2023. “Lithium Plus Antipsychotics or Anticonvulsants for Bipolar Disorder: Comparing Clinical Response and Metabolic Changes.” Australian and New Zealand Journal of Psychiatry 57, no. 1: 93–103. 10.1177/00048674221077619.35164524
- Konstantinou, G. , J. Hui , A. Ortiz , et al. 2022. “Repetitive Transcranial Magnetic Stimulation (rTMS) in Bipolar Disorder: A Systematic Review.” Bipolar Disorders 24, no. 1: 10–26. 10.1111/bdi.13099.33949063
- Krishnan, K. R. 2005. “Psychiatric and Medical Comorbidities of Bipolar Disorder.” Psychosomatic Medicine 67, no. 1: 1–8. 10.1097/01.psy.0000151489.36347.18.15673617
- Li, R. , R. Fu , W. M. Yang , et al. 2024. “Acute Treatment of Bilateral rTMS Combined With Antidepressants on the Plasma Fatty Acids for Major Depressive Episodes.” Brain Research 1843: 149125. 10.1016/j.brainres.2024.149125.39025398
- Li, Z. , J. Lai , P. Zhang , et al. 2022. “Multi‐Omics Analyses of Serum Metabolome, Gut Microbiome and Brain Function Reveal Dysregulated Microbiota‐Gut‐Brain Axis in Bipolar Depression.” Molecular Psychiatry 27, no. 10: 4123–4135. 10.1038/s41380-022-01569-9.35444255
- Lichtenstein, P. , B. H. Yip , C. Bjork , et al. 2009. “Common Genetic Determinants of Schizophrenia and Bipolar Disorder in Swedish Families: A Population‐Based Study.” Lancet 373, no. 9659: 234–239. 10.1016/S0140-6736(09)60072-6.19150704 PMC3879718
- Liu, J. C. , H. Yu , R. Li , et al. 2023. “A Preliminary Comparison of Plasma Tryptophan Metabolites and Medium‐ and Long‐Chain Fatty Acids in Adult Patients With Major Depressive Disorder and Schizophrenia.” Medicina (Kaunas, Lithuania) 59, no. 2: 413. 10.3390/medicina59020413.36837614 PMC9968143
- Liu, S. , H. Yu , P. Li , et al. 2022. “Dietary Nano‐Selenium Alleviated Intestinal Damage of Juvenile Grass Carp (Ctenopharyngodon Idella) Induced by High‐Fat Diet: Insight From Intestinal Morphology, Tight Junction, Inflammation, Anti‐Oxidization and Intestinal Microbiota.” Animal Nutrition 8, no. 1: 235–248. 10.1016/j.aninu.2021.07.001.34988305 PMC8688880
- McGirr, A. , F. Vila‐Rodriguez , J. Cole , et al. 2021. “Efficacy of Active Vs Sham Intermittent Theta Burst Transcranial Magnetic Stimulation for Patients With Bipolar Depression: A Randomized Clinical Trial.” JAMA Network Open 4, no. 3: e210963. 10.1001/jamanetworkopen.2021.0963.33710288 PMC7955269
- McGrath, J. J. , A. Al‐Hamzawi , J. Alonso , et al. 2023. “Age of Onset and Cumulative Risk of Mental Disorders: A Cross‐National Analysis of Population Surveys From 29 Countries.” Lancet Psychiatry 10, no. 9: 668–681. 10.1016/S2215-0366(23)00193-1.37531964 PMC10529120
- McNamara, R. K. , C. Chen , M. J. Tallman , et al. 2022. “Familial Risk for Bipolar I Disorder Is Associated With Erythrocyte Omega‐3 Polyunsaturated Fatty Acid Deficits in Youth With Attention‐Deficit Hyperactivity Disorder.” Psychiatry Research 313: 114587. 10.1016/j.psychres.2022.114587.35550258
- McNamara, R. K. , T. Rider , R. Jandacek , and P. Tso . 2014. “Abnormal Fatty Acid Pattern in the Superior Temporal Gyrus Distinguishes Bipolar Disorder From Major Depression and Schizophrenia and Resembles Multiple Sclerosis.” Psychiatry Research 215, no. 3: 560–567. 10.1016/j.psychres.2013.12.022.24439517 PMC3949121
- Merikangas, K. R. , R. Jin , J. P. He , et al. 2011. “Prevalence and Correlates of Bipolar Spectrum Disorder in the World Mental Health Survey Initiative.” Archives of General Psychiatry 68, no. 3: 241–251. 10.1001/archgenpsychiatry.2011.12.21383262 PMC3486639
- Morant‐Ferrando, B. , D. Jimenez‐Blasco , P. Alonso‐Batan , et al. 2023. “Fatty Acid Oxidation Organizes Mitochondrial Supercomplexes to Sustain Astrocytic ROS and Cognition.” Nature Metabolism 5, no. 8: 1290–1302. 10.1038/s42255-023-00835-6.PMC1044723537460843
- Mostafavi, H. , A. Harpak , I. Agarwal , D. Conley , J. K. Pritchard , and M. Przeworski . 2020. “Variable Prediction Accuracy of Polygenic Scores Within an Ancestry Group.” Elife 9: e48376. 10.7554/eLife.48376.31999256 PMC7067566
- Mullins, N. , A. J. Forstner , K. S. O'Connell , et al. 2021. “Genome‐Wide Association Study of More Than 40,000 Bipolar Disorder Cases Provides New Insights Into the Underlying Biology.” Nature Genetics 53, no. 6: 817–+. 10.1038/s41588-021-00857-4.34002096 PMC8192451
- Munkholm, K. , M. Vinberg , and L. V. Kessing . 2016. “Peripheral Blood Brain‐Derived Neurotrophic Factor in Bipolar Disorder: A Comprehensive Systematic Review and Meta‐Analysis.” Molecular Psychiatry 21, no. 2: 216–228. 10.1038/mp.2015.54.26194180
- Nestsiarovich, A. , C. E. S. Gaudiot , R. J. Baldessarini , E. Vieta , Y. Zhu , and M. Tohen . 2022. “Preventing New Episodes of Bipolar Disorder in Adults: Systematic Review and Meta‐Analysis of Randomized Controlled Trials.” European Neuropsychopharmacology 54: 75–89. 10.1016/j.euroneuro.2021.08.264.34489127
- Nguyen, T. D. , F. Hieronymus , R. Lorentzen , A. McGirr , and S. D. Ostergaard . 2021. “The Efficacy of Repetitive Transcranial Magnetic Stimulation (rTMS) for Bipolar Depression: A Systematic Review and Meta‐Analysis.” Journal of Affective Disorders 279: 250–255. 10.1016/j.jad.2020.10.013.33074144
- Nierenberg, A. A. , B. Agustini , O. Kohler‐Forsberg , et al. 2023. “Diagnosis and Treatment of Bipolar Disorder: A Review.” JAMA 330, no. 14: 1370–1380. 10.1001/jama.2023.18588.37815563
- Nunes, A. , H. G. Schnack , C. R. K. Ching , et al. 2020. “Using Structural MRI to Identify Bipolar Disorders – 13 Site Machine Learning Study in 3020 Individuals From the ENIGMA Bipolar Disorders Working Group.” Molecular Psychiatry 25, no. 9: 2130–2143. 10.1038/s41380-018-0228-9.30171211 PMC7473838
- Opel, N. , J. Goltermann , M. Hermesdorf , K. Berger , B. T. Baune , and U. Dannlowski . 2020. “Cross‐Disorder Analysis of Brain Structural Abnormalities in Six Major Psychiatric Disorders: A Secondary Analysis of Mega‐ and Meta‐Analytical Findings From the ENIGMA Consortium.” Biological Psychiatry 88, no. 9: 678–686. 10.1016/j.biopsych.2020.04.027.32646651
- Panezai, J. , and T. van Dyke . 2023. “Polyunsaturated Fatty Acids and Their Immunomodulatory Actions in Periodontal Disease.” Nutrients 15, no. 4: 821. 10.3390/nu15040821.36839179 PMC9965392
- Patel, Y. , N. Parker , J. Shin , et al. 2021. “Virtual Histology of Cortical Thickness and Shared Neurobiology in 6 Psychiatric Disorders.” JAMA Psychiatry 78, no. 1: 47–63. 10.1001/jamapsychiatry.2020.2694.32857118 PMC7450410
- Phulpoto, I. A. , W. Bobo , M. A. Qazi , and Z. S. Yu . 2024. “Lipopeptide Biosurfactants Enhanced Biohydrogen Evolution From Lignocellulose Biomass and Shaped the Microbial Community and Diversity.” International Journal of Energy Research 2024: Artn 3084702. 10.1155/2024/3084702.
- Plans, L. , C. Barrot , E. Nieto , et al. 2019. “Association Between Completed Suicide and Bipolar Disorder: A Systematic Review of the Literature.” Journal of Affective Disorders 242: 111–122. 10.1016/j.jad.2018.08.054.30173059
- Pompili, M. , P. Venturini , M. Palermo , et al. 2013. “Mood Disorders Medications: Predictors of Nonadherence—Review of the Current Literature.” Expert Review of Neurotherapeutics 13, no. 7: 809–825. 10.1586/14737175.2013.811976.23898852
- Pomponi, M. , L. Janiri , G. La Torre , et al. 2013. “Plasma Levels of n‐3 Fatty Acids in Bipolar Patients: Deficit Restricted to DHA.” Journal of Psychiatric Research 47, no. 3: 337–342. 10.1016/j.jpsychires.2012.11.004.23207113
- Quintero, M. , D. Stanisic , G. Cruz , J. G. M. Pontes , T. Costa , and L. Tasic . 2019. “Metabolomic Biomarkers in Mental Disorders: Bipolar Disorder and Schizophrenia.” Advances in Experimental Medicine and Biology 1118: 271–293. 10.1007/978-3-030-05542-4_14.30747428
- Rodrigues, J. E. , A. Martinho , V. Santos , et al. 2022. “Systematic Review and Meta‐Analysis on MS‐Based Proteomics Applied to Human Peripheral Fluids to Assess Potential Biomarkers of Bipolar Disorder.” International Journal of Molecular Sciences 23, no. 10: 5460. 10.3390/ijms23105460.35628270 PMC9141521
- Sackeim, H. A. 2016. “Acute Continuation and Maintenance Treatment of Major Depressive Episodes With Transcranial Magnetic Stimulation.” Brain Stimulation 9, no. 3: 313–319. 10.1016/j.brs.2016.03.006.27052475
- Sartorius, T. , C. Ketterer , S. Kullmann , et al. 2012. “Monounsaturated Fatty Acids Prevent the Aversive Effects of Obesity on Locomotion, Brain Activity, and Sleep Behavior.” Diabetes 61, no. 7: 1669–1679. 10.2337/db11-1521.22492529 PMC3379681
- Scaini, G. , S. S. Valvassori , A. P. Diaz , et al. 2020. “Neurobiology of Bipolar Disorders: A Review of Genetic Components, Signaling Pathways, Biochemical Changes, and Neuroimaging Findings.” Brazilian Journal of Psychiatry 42, no. 5: 536–551. 10.1590/1516-4446-2019-0732.32267339 PMC7524405
- Schroeder, F. A. , C. L. Lin , W. E. Crusio , and S. Akbarian . 2007. “Antidepressant‐Like Effects of the Histone Deacetylase Inhibitor, Sodium Butyrate, in the Mouse.” Biological Psychiatry 62, no. 1: 55–64. 10.1016/j.biopsych.2006.06.036.16945350
- Sharma, S. , and S. Fulton . 2013. “Diet‐Induced Obesity Promotes Depressive‐Like Behaviour That Is Associated With Neural Adaptations in Brain Reward Circuitry.” International Journal of Obesity 37, no. 3: 382–389. 10.1038/ijo.2012.48.22508336
- Shintani, A. O. , F. D. Rabelo‐da‐Ponte , L. E. Marchionatti , et al. 2023. “Prenatal and Perinatal Risk Factors for Bipolar Disorder: A Systematic Review and Meta‐Analysis.” Neuroscience and Biobehavioral Reviews 144: 104960. 10.1016/j.neubiorev.2022.104960.36375585
- Skonieczna‐Zydecka, K. , E. Grochans , D. Maciejewska , et al. 2018. “Faecal Short Chain Fatty Acids Profile Is Changed in Polish Depressive Women.” Nutrients 10, no. 12: ARTN 1939. 10.3390/nu10121939.30544489 PMC6316414
- Song, J. , S. E. Bergen , R. Kuja‐Halkola , H. Larsson , M. Landen , and P. Lichtenstein . 2015. “Bipolar Disorder and Its Relation to Major Psychiatric Disorders: A Family‐Based Study in the Swedish Population.” Bipolar Disorders 17, no. 2: 184–193. 10.1111/bdi.12242.25118125
- Vieta, E. , and T. Suppes . 2008. “Bipolar II Disorder: Arguments for and Against a Distinct Diagnostic Entity.” Bipolar Disorders 10, no. 1 pt. 2: 163–178. 10.1111/j.1399-5618.2007.00561.x.18199235
- Vigo, D. , G. Thornicroft , and R. Atun . 2016. “Estimating the True Global Burden of Mental Illness.” Lancet Psychiatry 3, no. 2: 171–178. 10.1016/S2215-0366(15)00505-2.26851330
- Wei, Y. B. , P. A. Melas , G. Wegener , A. A. Mathé , and C. Lavebratt . 2015. “Antidepressant‐Like Effect of Sodium Butyrate Is Associated With an Increase in TET1 and in 5‐Hydroxymethylation Levels in the Bdnf Gene.” International Journal of Neuropsychopharmacology 18, no. 2. pyu032. 10.1093/ijnp/pyv026.PMC436889125618518
- Yang, L. L. , D. Zhao , L. L. Kong , et al. 2019. “High‐Frequency Repetitive Transcranial Magnetic Stimulation (rTMS) Improves Neurocognitive Function in Bipolar Disorder.” Journal of Affective Disorders 246: 851–856. 10.1016/j.jad.2018.12.102.30795490
- Yano, J. M. , K. Yu , G. P. Donaldson , et al. 2015. “Indigenous Bacteria From the Gut Microbiota Regulate Host Serotonin Biosynthesis.” Cell 161, no. 2: 264–276. 10.1016/j.cell.2015.02.047.25860609 PMC4393509
- Yildiz, A. , S. Siafis , D. Mavridis , E. Vieta , and S. Leucht . 2023. “Comparative Efficacy and Tolerability of Pharmacological Interventions for Acute Bipolar Depression in Adults: A Systematic Review and Network Meta‐Analysis.” Lancet Psychiatry 10, no. 9: 693–705. 10.1016/S2215-0366(23)00199-2.37595997
- Zhang, D. , Y. P. Jian , Y. N. Zhang , et al. 2023. “Short‐Chain Fatty Acids in Diseases.” Cell Communication and Signaling 21, no. 1: 212. 10.1186/s12964-023-01219-9.37596634 PMC10436623
- Zhang, M. , X. W. Li , L. Dong , et al. 2023. “Assessment of Causal Relationships Between Omega‐3 and Omega‐6 Polyunsaturated Fatty Acids in Bipolar Disorder: A 2‐Sample Bidirectional Mendelian Randomization Study.” Food & Function 14, no. 13: 6200–6211. 10.1039/d3fo00265a.37345345
- Zhou, Z. , X. Zhou , Y. Zhang , Y. Yang , L. Wang , and Z. Wu . 2023. “Butyric Acid Inhibits Oxidative Stress and Inflammation Injury in Calcium Oxalate Nephrolithiasis by Targeting CYP2C9.” Food and Chemical Toxicology 178: 113925. 10.1016/j.fct.2023.113925.37414240
- Zhuang, H. , X. T. Yao , H. Li , et al. 2022. “Long‐Term High‐Fat Diet Consumption by Mice Throughout Adulthood Induces Neurobehavioral Alterations and Hippocampal Neuronal Remodeling Accompanied by Augmented Microglial Lipid Accumulation.” Brain Behavior and Immunity 100: 155–171. 10.1016/j.bbi.2021.11.018.34848340
- Ziaei, S. , S. Mohammadi , M. Hasani , et al. 2024. “A Systematic Review and Meta‐Analysis of the Omega‐3 Fatty Acids Effects on Brain‐Derived Neurotrophic Factor (BDNF).” Nutritional Neuroscience 27, no. 7: 715–725. 10.1080/1028415X.2023.2245996.37589276
Til din tryghed. MitLivMed er et fællesskab. Vi yder ikke krisestøtte eller medicinsk rådgivning og erstatter ikke din behandler. Fortællinger og mestringsforslag er medlemmernes egne erfaringer. Er du i krise? Find akut hjælp her.